

How can neuroscientists tell that distant parts of the brain are talking to each other?
They can look for a physical connection, like neurons that carry signals between the two. They could probe the brain with electricity. However, to keep the brain intact and examine cheap oakley function in a living person or animal, a less invasive approach may be in order.
Looking for functional connectivity has grown in popularity in recent years. This is a way of analyzing fMRI (functional magnetic resonance imaging) scans, which measure activity in the brain by looking at changes in blood oxygen. If two regions of the brain “light up†at the same time, and do so in a consistent enough pattern, that indicates that those two regions are connected.*

Functional connectivity networks
Shella Keilholz and her colleagues have been looking at functional connectivity data very closely, and how the apparent connections fluctuate over short time periods. This newer form of analysis is called “dynamic†or “time-varying†functional connectivity. Functional connectivity analyses can be performed while the person or animal in the scanner is at rest, not doing anything complicated.
“Even if you’re lying in the scanner daydreaming, your mind is jumping around,†she says. “But the way neuroscientists usually average fMRI data over several minutes means losing lots of information.â€
Keilholz is part of the Wallace H Coulter Department of Biomedical Engineering at Georgia Tech and Emory. She participated in a workshop at the most recent Human Brain Mapping meeting in Seattle devoted to the topic. She says neuroscientists have already started using dynamic functional connectivity to detect differences in the brain’s network properties in schizophrenia. However, some of that information may be noise. Skeptical tests have shown that head motion or breathing can push scientists into inferring connections that aren’t really there. For dynamic analysis especially, preprocessing can lead to apparent correlations between two randomly matched signals.
“I got into this field as a skeptic,†she says. “Several years ago, I didn’t believe functional connectivity really reflects coordinated brain activity.â€
Now Keilholz and her colleagues have shown for the first time that dynamic functional connectivity data is “groundedâ€, because it is linked with changes in electrical signals within the brain. The results were published in July in the journal NeuroImage. The first author is graduate student Garth Thompson.
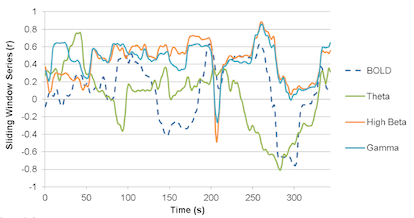
BOLD is the fMRI signal related to blood oxygen levels. Theta, beta and gamma are frequencies of brain electrical activity.
The experiments were performed with anesthetized rats, so whatever correlations they’re seeing comes from the level of brain activity that remains after anesthesia. The rats http://www.gooakley.com/ were placed in an fMRI scanner at the same time that electrodes recorded signals from the left and right somatosensory cortex, the region of the brain responsible for the sense of touch.
However, Keilholz and colleagues are also performing similar analyses with awake humans, but substituting EEG (electroencephalography) recordings from the scalp instead of electrodes inserted into the brain.
“If the electrodes are like a microphone recording the voice of one person, EEG is like listening to a conversation through a wall, while people are talking on all sides of you,†she says. “Still, it’s much less invasive and more practical to use with experiments involving humans.â€
This line of investigations could provide additional grounding for dynamic functional connectivity analyses, leading even more scientists to use it.
* Some have argued the term “connectivity†is misleading because these experiments tell us more about software than hardware, but neuroscientists have also shown that regions that are connected in this functional way are also connected by signal-conducting grey matter, as measured by diffusion tensor imaging.